Synthetic Population
The goal of our project is to impute a synthetic population that represents Accomack and Northampton communities by combining information from various sources of data, administrative and survey data to get a representation of those rural communities down to the level of individual households and farms. That will be used as an input into agent based models for stakeholder decisions, and hydrological models to measure flood hazard, water supply, and groundwater salinization. The use of synthetic populations is an approach that can retain aggregate population characteristics at larger community levels (e.g., Census block, neighborhood, farming sector) while constructing “synthetic” households using imputation methods without compromising privacy.
Methodology
The method we used for the construction of Synthetic Population is Iterative Proportional Fitting. IPF is computationally efficient,involves resampling from microdata and can include housing data for more precise sub-block group estimation. In order to implement IPF procedure in R, we use the package mipfp.
IPF estimates a joint table given marginal constraints
The Procedure is :
Adjust cells using marginal column totals; divide by (cell column sums/ marginal column totals)
Adjust cells using marginal row totals; divide by (cell row sums/ marginal row totals)
Iterate (1) and (2) until convergence
Resampling and Adding Locations
IPF produces a maximum entropy estimate of the joint table subject to constraints of the marginals
Our IPF output was a list with categories like Race, Income level, Age, Tenure and number of households
The result is a realization of synthetic households over the ESVA with attached housing characteristics and census sociodemographic data.
IPF Output
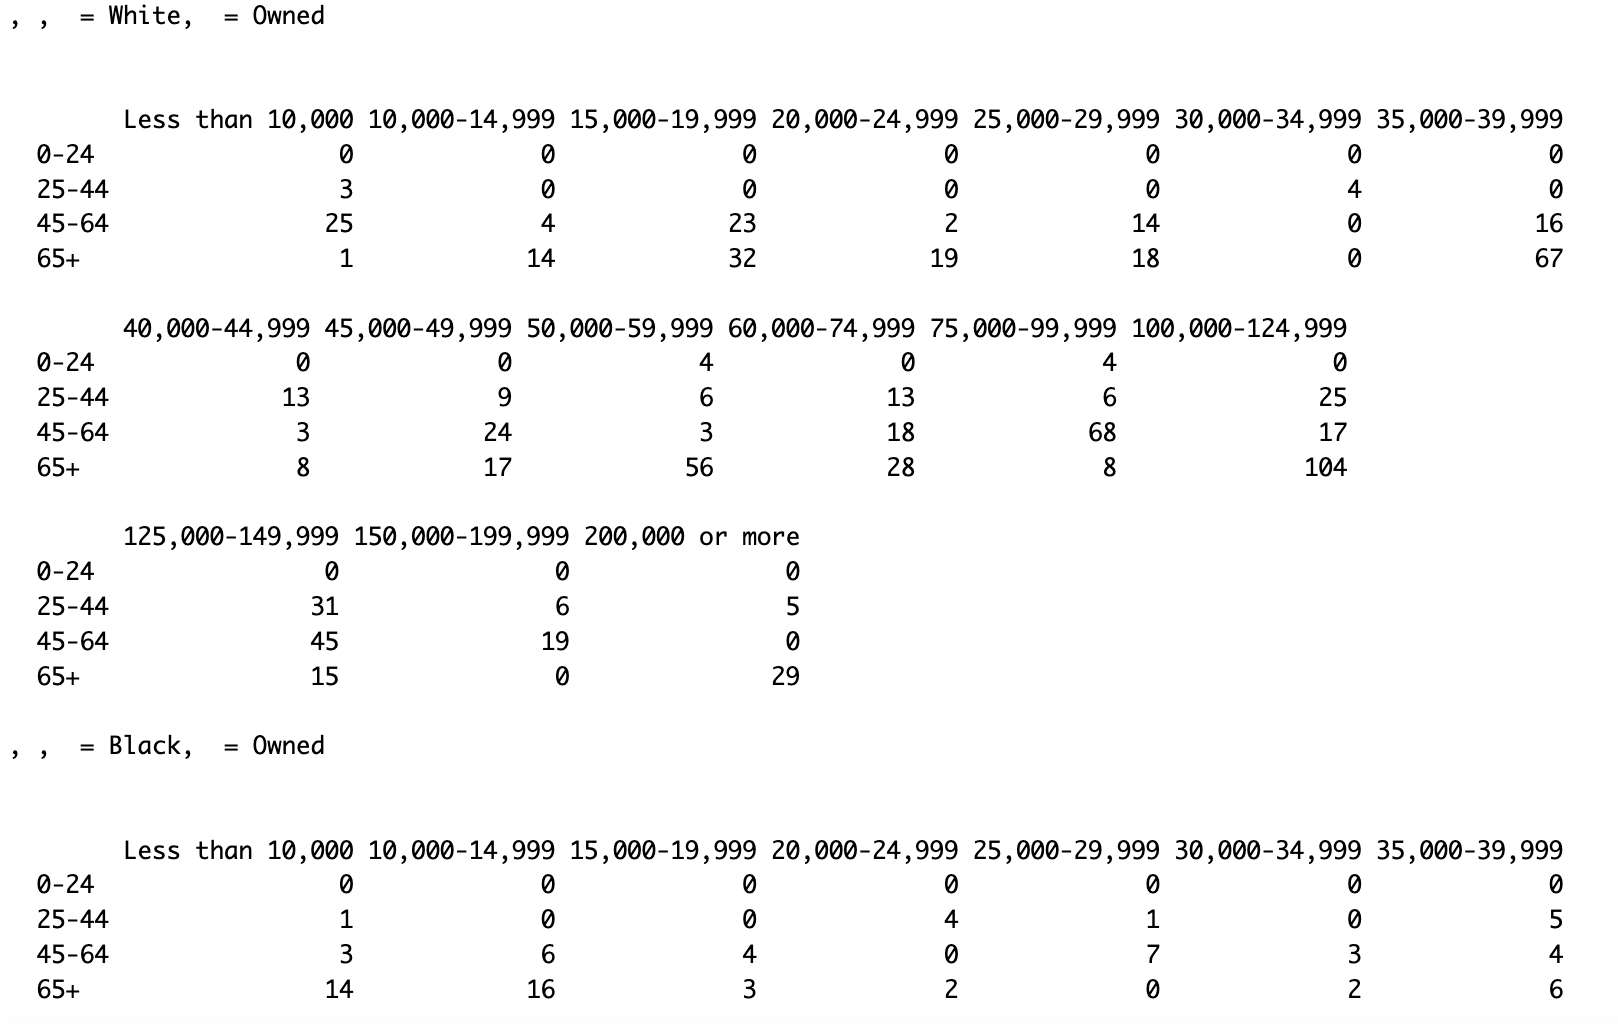
The below picture is a screenshot from the result of Iterative Proportional Fitting output. This picture is a small portion from IPF output performed on one census tract. This picture shows that there are four variables: Race, Tenure, Age, and Household Income. It shows the number of householders for different conditions of variables.
The output contains values for various conditions of those variables.
Races : White, Black, AIAN, Asian, NHPI and Other
Tenure : Owned, Rented
Age: 0-24, 25-44, 45 -64, 65+
Salary : Less than 10,000, 10,000-14999 .... 200,000 or more
For example, the second row of the first column has a value of 3. This indicates that 3 householders who are White with an income less than 10,000, between the ages 25 - 44 and own their home need to be sampled with replacement from the microdata.

Shown below is a data frame from the IPF output of this same Census tract. The "Freq" column indicates the number of householders that need to be sampled with replacement to create the synthetic population.
The Resampling process involved with microdata is a simple random sample with replacement
SERIALNO from the ACS PUMS data tables (see data - ACS) were sampled to matches each cell from the ipf output for all census tracts to create the full synthetic population
Final step involves placing the synthetic population into households. The latitudes and longitudes of the housing data were extracted and randomly assigned to the complete synthetic population.
Northampton and Accomack Synthetic Population
A function was created to automate the IPF process and perform Iterative Proportional Fitting on all census tracts in Accomack and Northampton county. The synthetic population data frame for both counties generated after attaching serial numbers and coordinates of household is shown below.
Northampton Synthetic Population
Accomack Synthetic Population
Estimating Variability
To account for the error in the IPF procedure, we can repeat the steps over multiple runs for sample-based error estimates.
To account for the sampling variability, resample the marginal tables for each run using ACS margins of error.
Improving Household Assignment
Synthetic households from IPF output are assigned to actual housing units using tax data. Currently this assignment is done at random within a given census tract. As a next step, we will weight the assignment between synthetic households and real housing units probabilistically based on e.g. income, taxes, and property value.